
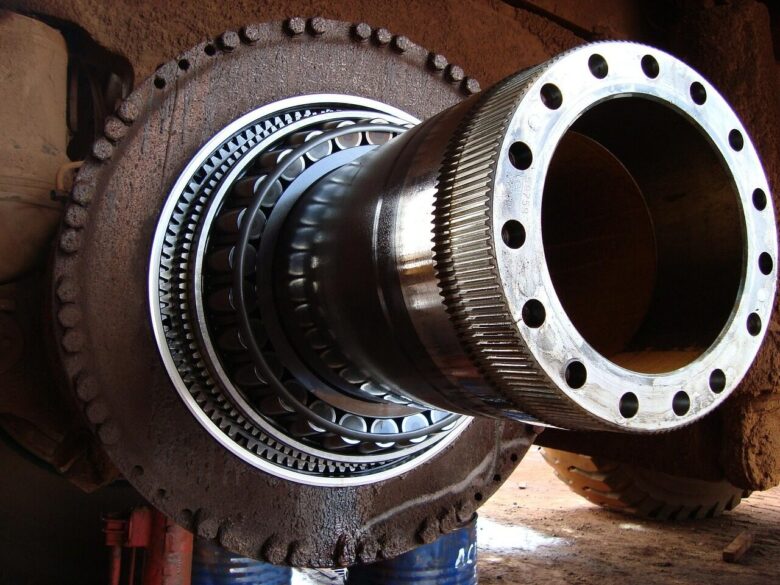
Learning how to interpret vibration spectra is one of the most useful skills for detecting early bearing failure before it becomes a serious machine problem. A vibration spectrum turns machine movement into frequency information, making it easier to separate normal running behavior from signs of damage, poor lubrication, looseness, misalignment or developing bearing defects.
For beginners, the difficult part is not simply finding a peak on a graph. The real challenge is understanding what that peak means, whether it is related to shaft speed, bearing geometry, machine load, resonance, sensor placement or another fault that looks similar. A bearing problem rarely announces itself with one perfect signal.
Early bearing failure often appears as small repetitive impacts, rising high-frequency energy, sidebands around bearing fault frequencies or changes in the vibration trend compared with a healthy baseline. In many cases, the first warning is not a loud noise or a hot bearing, but a subtle change in the spectrum or envelope spectrum.
This guide explains the process in a practical way: what to look for, how to compare frequency patterns, which mistakes to avoid and when to confirm the diagnosis with a qualified vibration analyst, bearing manufacturer or maintenance specialist. The goal is not to guess from one graph, but to build a safer interpretation using evidence.
Important safety note: vibration analysis should support maintenance decisions, not replace safe work procedures. Before inspecting, adjusting or replacing rotating equipment, follow lockout/tagout rules, use proper personal protective equipment and confirm critical decisions with qualified maintenance personnel or the equipment manufacturer.
What a vibration spectrum actually shows
A vibration spectrum is usually created with an FFT, or Fast Fourier Transform. Instead of showing vibration only as movement over time, it shows vibration amplitude at different frequencies. The horizontal axis is frequency, often in Hz or orders of running speed, and the vertical axis is amplitude, often shown as acceleration, velocity or displacement.
For bearing analysis, this matters because different machine problems tend to produce energy in different frequency areas. Unbalance usually appears strongly at running speed. Misalignment can create energy at one and two times running speed. Looseness can produce several harmonics. Bearing faults often create impact-related frequencies based on bearing geometry.
Na prática, a single spectrum is only one piece of the diagnosis. A reliable interpretation usually compares several views: the time waveform, acceleration spectrum, velocity spectrum, envelope spectrum, trend history, load condition and physical inspection results. When these signs point in the same direction, the diagnosis becomes much stronger.
| Spectrum element | What it means | Why it matters for bearing analysis |
|---|---|---|
| Frequency peak | A vibration component occurring at a specific frequency. | It may match running speed, a bearing fault frequency, gear mesh or another machine component. |
| Amplitude | The vibration level at that frequency. | Rising amplitude over time can indicate worsening condition, but it must be compared with a baseline. |
| Harmonics | Multiples of a frequency, such as 2X, 3X or 4X. | Multiple harmonics can appear with looseness, impacts or advancing bearing damage. |
| Sidebands | Peaks spaced around a main frequency by another frequency. | Sidebands around bearing fault frequencies can help identify modulation caused by rotation or cage movement. |
| Noise floor | The general background energy across the spectrum. | A rising high-frequency noise floor may indicate lubrication problems, rubbing or early surface distress. |
Key bearing frequencies you need to recognize
Rolling element bearings can generate characteristic frequencies when a defect passes through the load zone. The four common terms are BPFO, BPFI, BSF and FTF. These are not random numbers. They are based on bearing geometry, number of rolling elements, shaft speed, pitch diameter, rolling element diameter and contact angle.
BPFO means Ball Pass Frequency Outer race. BPFI means Ball Pass Frequency Inner race. BSF means Ball Spin Frequency. FTF means Fundamental Train Frequency, often related to the cage. These frequencies are usually calculated by vibration software or taken from bearing databases, because exact calculation requires correct bearing data.
A common mistake is expecting these frequencies to be perfect whole-number multiples of shaft speed. They usually are not. They can shift slightly because of slip, load, speed variation and bearing geometry. This is why a good analyst searches near the expected frequency, not only at one exact line in the spectrum.
| Bearing frequency | Typical meaning | Common spectrum clue |
|---|---|---|
| BPFO | Possible outer race defect. | Peak near BPFO with harmonics, often more stable because the outer race is usually stationary. |
| BPFI | Possible inner race defect. | Peak near BPFI with sidebands spaced at running speed, because the defect rotates through the load zone. |
| BSF | Possible rolling element defect. | Energy near ball or roller spin frequency, often with sidebands and less stable patterns. |
| FTF | Possible cage or train-related issue. | Low-frequency modulation, irregular impacts or sidebands spaced by cage frequency. |
How to interpret vibration spectra for early bearing failure
To interpret vibration spectra for early bearing failure, start with the machine speed. Without knowing the true running speed, it is easy to confuse bearing frequencies with harmonics, belt frequencies, gear mesh or electrical-related components. Speed should be measured or confirmed during the same operating condition as the vibration reading.
Next, compare the current spectrum with a known healthy baseline. Early bearing defects are often small, so they may not look alarming in isolation. A peak that looks modest today may be important if it was not present last month or if it is increasing steadily under similar speed and load conditions.
Then, look for impact behavior. Bearing defects often create short, repetitive impacts. In a normal spectrum, this can appear as bearing fault frequency harmonics. In an envelope spectrum, the same defect may become easier to see because envelope analysis extracts the repetitive impact pattern from high-frequency resonance.
-
Confirm the machine speed.
Measure or verify the actual RPM during data collection. Do not rely only on motor nameplate speed, because slip, variable frequency drives and load changes can shift the real running speed.
-
Identify the bearing type and geometry.
Use the bearing number, manufacturer data or a trusted bearing database to estimate BPFO, BPFI, BSF and FTF. Guessing these values can lead to a false diagnosis.
-
Check the standard spectrum first.
Review acceleration and velocity spectra for peaks, harmonics, sidebands and changes in the noise floor. Velocity is often useful for general machine severity, while acceleration is useful for higher-frequency impact behavior.
-
Use envelope analysis when early damage is suspected.
Envelope analysis is especially useful when impacts are exciting a high-frequency resonance but the fault frequency is not clear in the normal spectrum.
-
Compare with previous readings.
Trend the same measurement point, direction, speed and load condition. A consistent increase is usually more meaningful than one isolated measurement.
-
Rule out similar faults.
Check for looseness, misalignment, unbalance, belt problems and gear-related frequencies before blaming the bearing. Several mechanical faults can raise vibration near the same areas.
-
Confirm with supporting evidence.
Use temperature, lubrication condition, ultrasound, oil analysis, visual inspection or bearing inspection when available. The safest conclusion comes from multiple signs, not one spectrum peak.
Practical signs that suggest a developing bearing defect
Early bearing failure often begins with surface distress, poor lubrication film, contamination or small defects on the raceway or rolling elements. At this stage, the machine may still run normally. Operators may not hear anything unusual, and overall vibration may remain within an acceptable range.
One practical sign is a rise in high-frequency acceleration. Another is the appearance of bearing fault frequencies in the envelope spectrum. If a defect grows, harmonics can become clearer, sidebands may appear, and the vibration pattern may become more repetitive.
Em muitos casos, outer race defects are easier to detect than inner race or rolling element defects because the outer race is closer to the sensor path when mounted on the bearing housing. Inner race defects often show stronger modulation because the defect rotates in and out of the load zone.
- Confirm that the same sensor location and direction were used for each reading.
- Check whether the machine was operating under similar speed and load.
- Look for new peaks near calculated bearing fault frequencies.
- Check for harmonics of BPFO, BPFI, BSF or FTF.
- Look for sidebands around bearing-related peaks.
- Compare the high-frequency noise floor with previous readings.
- Review lubrication condition, temperature and recent maintenance history.
How to separate bearing faults from other machine problems
Not every high vibration reading means bearing failure. A machine with unbalance, misalignment or looseness can also damage bearings over time, but the spectrum pattern may point to the root cause rather than the bearing itself. This distinction is important because replacing the bearing without correcting the cause can lead to repeated failure.
Unbalance usually creates a strong component at 1X running speed, especially in the radial direction. Misalignment may show 1X and 2X components, sometimes with higher axial vibration. Looseness often creates multiple running-speed harmonics. Bearing defects, by contrast, often appear at non-synchronous frequencies related to the bearing geometry.
Before making a maintenance decision, compare the vibration pattern with machine design. A fan, pump, gearbox, motor and compressor do not always behave the same way. Belt drives, gear mesh, blade pass frequencies and electrical frequencies can all add peaks that may confuse the interpretation.
| Possible issue | Typical spectrum pattern | How to avoid confusion |
|---|---|---|
| Unbalance | Dominant 1X running speed peak. | Check radial vibration, phase behavior and whether the peak follows machine speed. |
| Misalignment | 1X and 2X components, often with axial vibration. | Review coupling condition, alignment history and axial measurement direction. |
| Mechanical looseness | Many harmonics of running speed. | Inspect mounting bolts, base, bearing housing, soft foot and structural looseness. |
| Bearing defect | BPFO, BPFI, BSF or FTF components with harmonics or sidebands. | Use bearing data, envelope analysis and trend history before confirming the diagnosis. |
| Lubrication problem | Rising high-frequency energy or broadband noise. | Check lubricant type, quantity, contamination, relubrication interval and temperature. |
Checklist before trusting a bearing diagnosis
A vibration spectrum can be misleading when the data collection setup is inconsistent. Sensor mounting, measurement direction, frequency range, resolution and machine operating condition all affect the result. Poor data quality can make a healthy bearing look suspicious or hide an early defect.
Um erro comum é comparing a reading taken at full load with a previous reading taken at low load. Another common error is changing the sensor location and assuming the trend is still valid. For trend-based analysis, consistency is not optional; it is part of the measurement method.
Before deciding that a bearing is failing, make sure the measurement can be trusted. If the data is weak, the correct next step is to repeat the reading under controlled conditions rather than replacing parts based on uncertainty.
- The sensor was mounted firmly, not held loosely by hand.
- The same measurement point was used as previous readings.
- The same direction was measured, such as horizontal, vertical or axial.
- The machine speed was recorded during the measurement.
- The load condition was similar to the baseline or clearly documented.
- The frequency range was high enough for bearing impact analysis.
- The resolution was detailed enough to separate close peaks.
- The bearing number or geometry was confirmed before calculating fault frequencies.
- Other faults such as looseness, misalignment and unbalance were considered.
Common mistakes when reading bearing spectra
The first major mistake is diagnosing bearing failure from overall vibration alone. Overall vibration is useful for screening, but it can miss early localized defects. A bearing can begin to fail while the overall value still looks acceptable, especially if the defect energy is concentrated in high frequencies.
The second mistake is treating every peak near a calculated fault frequency as proof of bearing damage. Bearing frequencies are estimates, and real machines contain many vibration sources. The peak must make sense with harmonics, sidebands, trend changes, waveform impacts and the machine’s physical condition.
The third mistake is ignoring lubrication. Poor lubrication can create high-frequency energy before a clean BPFO or BPFI pattern appears. Adding the wrong lubricant or overgreasing can also create problems. If lubrication history is unknown, the spectrum should be interpreted carefully.
| Mistake | Possible consequence | Better approach |
|---|---|---|
| Using only overall vibration | Early bearing defects may be missed. | Review spectra, envelope data, waveform and trends. |
| Ignoring speed variation | Fault frequencies may appear shifted. | Record actual RPM at the time of measurement. |
| Forgetting sensor consistency | Trend comparisons become unreliable. | Use the same point, direction and mounting method. |
| Assuming every high-frequency rise is a bearing defect | Unnecessary replacement or wrong repair action. | Check lubrication, rubbing, resonance and process changes. |
| Replacing the bearing without root cause analysis | The new bearing may fail again. | Investigate alignment, fits, contamination, seals, load and installation practices. |
When envelope analysis becomes important
Envelope analysis is often used when early bearing impacts are too small or too high-frequency to appear clearly in a standard vibration spectrum. A small defect can excite a structural resonance each time a rolling element passes over it. The envelope process helps reveal the repetition rate of those impacts.
This does not mean envelope analysis is magic. It still depends on correct setup, suitable filter selection, good sensor mounting and proper interpretation. If the filter band is poorly chosen, the result may hide the fault or highlight unrelated noise.
In practical maintenance work, envelope analysis is especially useful when the standard velocity spectrum looks normal but the machine has a rising acceleration trend, ultrasonic noise, suspected lubrication distress or early impact behavior in the waveform.
Useful clues in an envelope spectrum
A clear BPFO peak with harmonics may suggest an outer race defect. BPFI with sidebands spaced by running speed may suggest an inner race defect. BSF with sidebands can suggest rolling element damage. FTF-related modulation may suggest cage involvement, but cage faults can be irregular and should be confirmed carefully.
When to seek professional help or official support
You should involve a qualified vibration analyst, reliability engineer, bearing manufacturer or equipment OEM when the machine is critical, the spectrum is unclear, the vibration is rising quickly or the repair decision is expensive. Early bearing detection is useful, but a wrong diagnosis can waste parts, labor and downtime.
Professional support is also important when the machine has variable speed, complex gearboxes, sleeve bearings, high-speed spindles, safety-critical operation or a history of repeated bearing replacements. These cases often require deeper analysis, phase readings, operating deflection shapes, oil analysis, thermography or detailed root cause investigation.
If the bearing has already been removed, preserve evidence. Do not clean or damage the bearing before inspection if root cause analysis is needed. Document operating conditions, lubricant, photos, mounting marks, temperature history and vibration trends. This information can help identify whether the failure came from fatigue, contamination, poor lubrication, electrical erosion, overload, misalignment or installation damage.
Conclusion
Knowing how to interpret vibration spectra helps maintenance teams detect early bearing failure with more confidence, but the best results come from combining spectrum patterns with trend history, machine speed, bearing geometry and operating context. A single peak is rarely enough to prove the whole story.
The safest approach is to look for consistent evidence: bearing fault frequencies, harmonics, sidebands, rising high-frequency energy, waveform impacts and supporting signs such as temperature or lubrication changes. When these clues agree, the diagnosis becomes more reliable and the maintenance plan can be better timed.
If the machine is critical, the fault pattern is unclear or the repair decision carries high cost or safety risk, confirm the interpretation with a qualified vibration analyst, bearing manufacturer or official equipment support. Interpreting vibration spectra is most valuable when it prevents guesswork, not when it replaces professional judgment.
FAQ
1. What is the first thing to check in a vibration spectrum?
The first thing to check is the actual running speed of the machine. Many spectrum features are interpreted as multiples of shaft speed, so an incorrect RPM can lead to the wrong diagnosis. Do not rely only on nameplate speed if the machine uses a variable frequency drive, belt drive or operates under changing load. Once running speed is confirmed, identify 1X, harmonics, bearing fault frequencies and any sidebands. This gives the spectrum a reference point and makes the rest of the analysis more reliable.
2. Can overall vibration detect early bearing failure?
Overall vibration can help screen machine condition, but it is not always sensitive enough for early bearing failure. A small raceway or rolling element defect may create high-frequency impacts while the overall vibration value still appears normal. That is why analysts often review acceleration spectra, envelope spectra, time waveforms and vibration trends. Overall values are useful for alarms and quick comparisons, but they should not be the only evidence used to confirm or reject an early bearing problem.
3. What does BPFO mean in bearing analysis?
BPFO means Ball Pass Frequency Outer race. It is the frequency at which rolling elements pass over a defect on the outer race of a bearing. In many machines, outer race defects produce a more stable vibration pattern because the outer race is fixed in the housing. A spectrum may show a peak near BPFO with harmonics. However, BPFO should still be compared with the bearing data, sensor location, load condition and trend history before making a maintenance decision.
4. What does BPFI mean in a vibration spectrum?
BPFI means Ball Pass Frequency Inner race. It is associated with a possible defect on the inner race of a rolling element bearing. Because the inner race usually rotates, the defect moves in and out of the load zone, which can create amplitude modulation. In the spectrum, this may appear as BPFI with sidebands spaced at running speed. BPFI patterns can be harder to read than outer race patterns, so supporting evidence from trends and envelope analysis is important.
5. Why are bearing fault frequencies not exact multiples of RPM?
Bearing fault frequencies depend on bearing geometry, not only shaft speed. The number of rolling elements, pitch diameter, rolling element diameter and contact angle all affect the calculated values. Real machines also have slip, load changes and manufacturing tolerances, so the actual peak may not fall exactly on the calculated line. This is why analysts usually search near the expected frequency and look for a pattern of harmonics, sidebands and trend changes rather than one perfect match.
6. What is envelope analysis used for?
Envelope analysis is used to detect repetitive impacts that may be hidden in a normal spectrum. Early bearing defects often excite high-frequency resonance each time a rolling element contacts the damaged area. The envelope process extracts the repetition rate of those impacts, making BPFO, BPFI, BSF or FTF components easier to see. It is especially useful when standard velocity readings look normal but acceleration, ultrasound or waveform data suggests an early bearing problem.
7. How can I tell bearing failure from unbalance?
Unbalance usually produces a strong vibration component at 1X running speed, especially in the radial direction. Bearing defects usually appear at calculated bearing fault frequencies, which are often non-synchronous with shaft speed. They may also show harmonics, sidebands and high-frequency impact behavior. However, severe unbalance can damage bearings over time, so the correct question is not only “which pattern is present?” but also “what caused the bearing stress?” Phase analysis and trend history can help separate these issues.
8. How can misalignment affect bearing vibration?
Misalignment can increase load on bearings and create vibration patterns that may include 1X and 2X running speed components, sometimes with strong axial vibration. If misalignment is not corrected, a new bearing may fail again after replacement. When a spectrum shows possible bearing damage, it is wise to check coupling alignment, soft foot, base condition and installation history. Bearing replacement alone may not solve the problem if misalignment is the root cause.
9. What role does lubrication play in bearing spectra?
Lubrication problems can create high-frequency vibration before a clean bearing fault frequency appears. Too little lubricant, wrong lubricant, contamination or overgreasing may increase friction, temperature and broadband noise. In early stages, the spectrum may show rising acceleration or a higher noise floor rather than a clear BPFO or BPFI peak. For this reason, lubrication history, relubrication intervals, lubricant condition and temperature should always be reviewed when bearing failure is suspected.
10. How often should vibration readings be taken?
The correct interval depends on machine criticality, speed, load, failure history and production risk. Critical machines may need continuous monitoring or frequent route-based measurements. Less critical machines may be checked monthly or quarterly. The most important point is consistency: use the same measurement points, directions, operating conditions and analysis settings. A good trend is built from comparable readings. Random measurements taken under different conditions are much harder to interpret safely.
11. Can vibration analysis predict the exact date a bearing will fail?
Vibration analysis can help estimate condition and support maintenance planning, but it should not be treated as an exact countdown. Bearing deterioration depends on load, speed, lubrication, contamination, installation quality and operating changes. A defect can grow slowly for a time and then accelerate quickly. Good vibration trending can show whether the condition is stable, worsening or urgent, but repair timing should also consider machine criticality, safety risk, spare parts and professional judgment.
12. When should a bearing be replaced based on vibration data?
A bearing should not be replaced only because one suspicious peak appears. Replacement becomes more justified when bearing fault frequencies are confirmed, amplitudes are increasing, harmonics or sidebands are developing, waveform impacts are present and supporting signs such as heat, noise, lubrication issues or process instability exist. For critical equipment, involve a qualified analyst or OEM before waiting too long. For non-critical equipment, planned replacement may be scheduled when the trend shows clear deterioration and operating risk is increasing.
Editorial note: this article is educational and does not replace a professional vibration analysis program, OEM recommendation or qualified mechanical inspection for critical rotating equipment. Machines with safety, production or high-cost risks should be assessed by trained personnel using verified measurement procedures.
Official References
- ISO — ISO 20816-3:2022 Mechanical vibration, measurement and evaluation of machine vibration
- ISO — ISO 15243:2017 Rolling bearings, damage and failures
- SKF — Bearing damage and failure analysis
- Mobius Institute — Vibration Analysis Dictionary
- Fluke — Vibration testing equipment and mechanical maintenance resources

Elena Voss is a certified industrial maintenance technician and safety compliance specialist with over 12 years of hands-on experience across manufacturing, energy, and facility management sectors. She holds certifications in OSHA 30-Hour General Industry, NFPA 70E Arc Flash Safety, and ISO 45001 Lead Auditor. Elena has spent her career working directly on thermal imaging inspections, lockout/tagout implementation, and precision calibration programs for industrial equipment. She writes to translate complex technical standards into practical, field-tested guidance that maintenance teams can apply immediately.